
New risk assessment model
Simple formula for 'Risk = Threat x Vulnerability x Consequence' is standard across the security and emergency management industry. There is a better way to dynamically quantify real risks.

Summertime is risk assessment season. While schools are closed, security consultants conduct training sessions and write security assessments for the next school year. NFL and college football stadiums complete risk assessments ahead of the upcoming football season. Local governments and infrastructure facilities are preparing risk reports to get ready for the next fiscal year homeland security grant cycle.
To quantify the risks to schools, stadiums, government buildings, powerplants, subway stations, and even local parks, the same simple formula has been used since the Department of Homeland Security was created after 9/11.
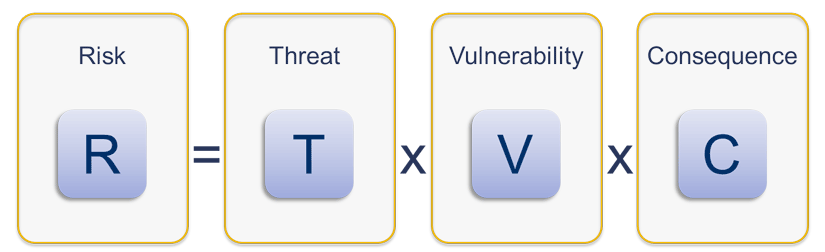
On the surface this seems simple and logical. To figure out the risk of something bad happening you use a 1-5 scale to assign values to the threat (probability of a bad thing happening), vulnerability (probability that the threat will cause damage/impact), and consequence (amount of damage or disruption from the threat). The 1-5 scores for each are multiplied to get a risk score.
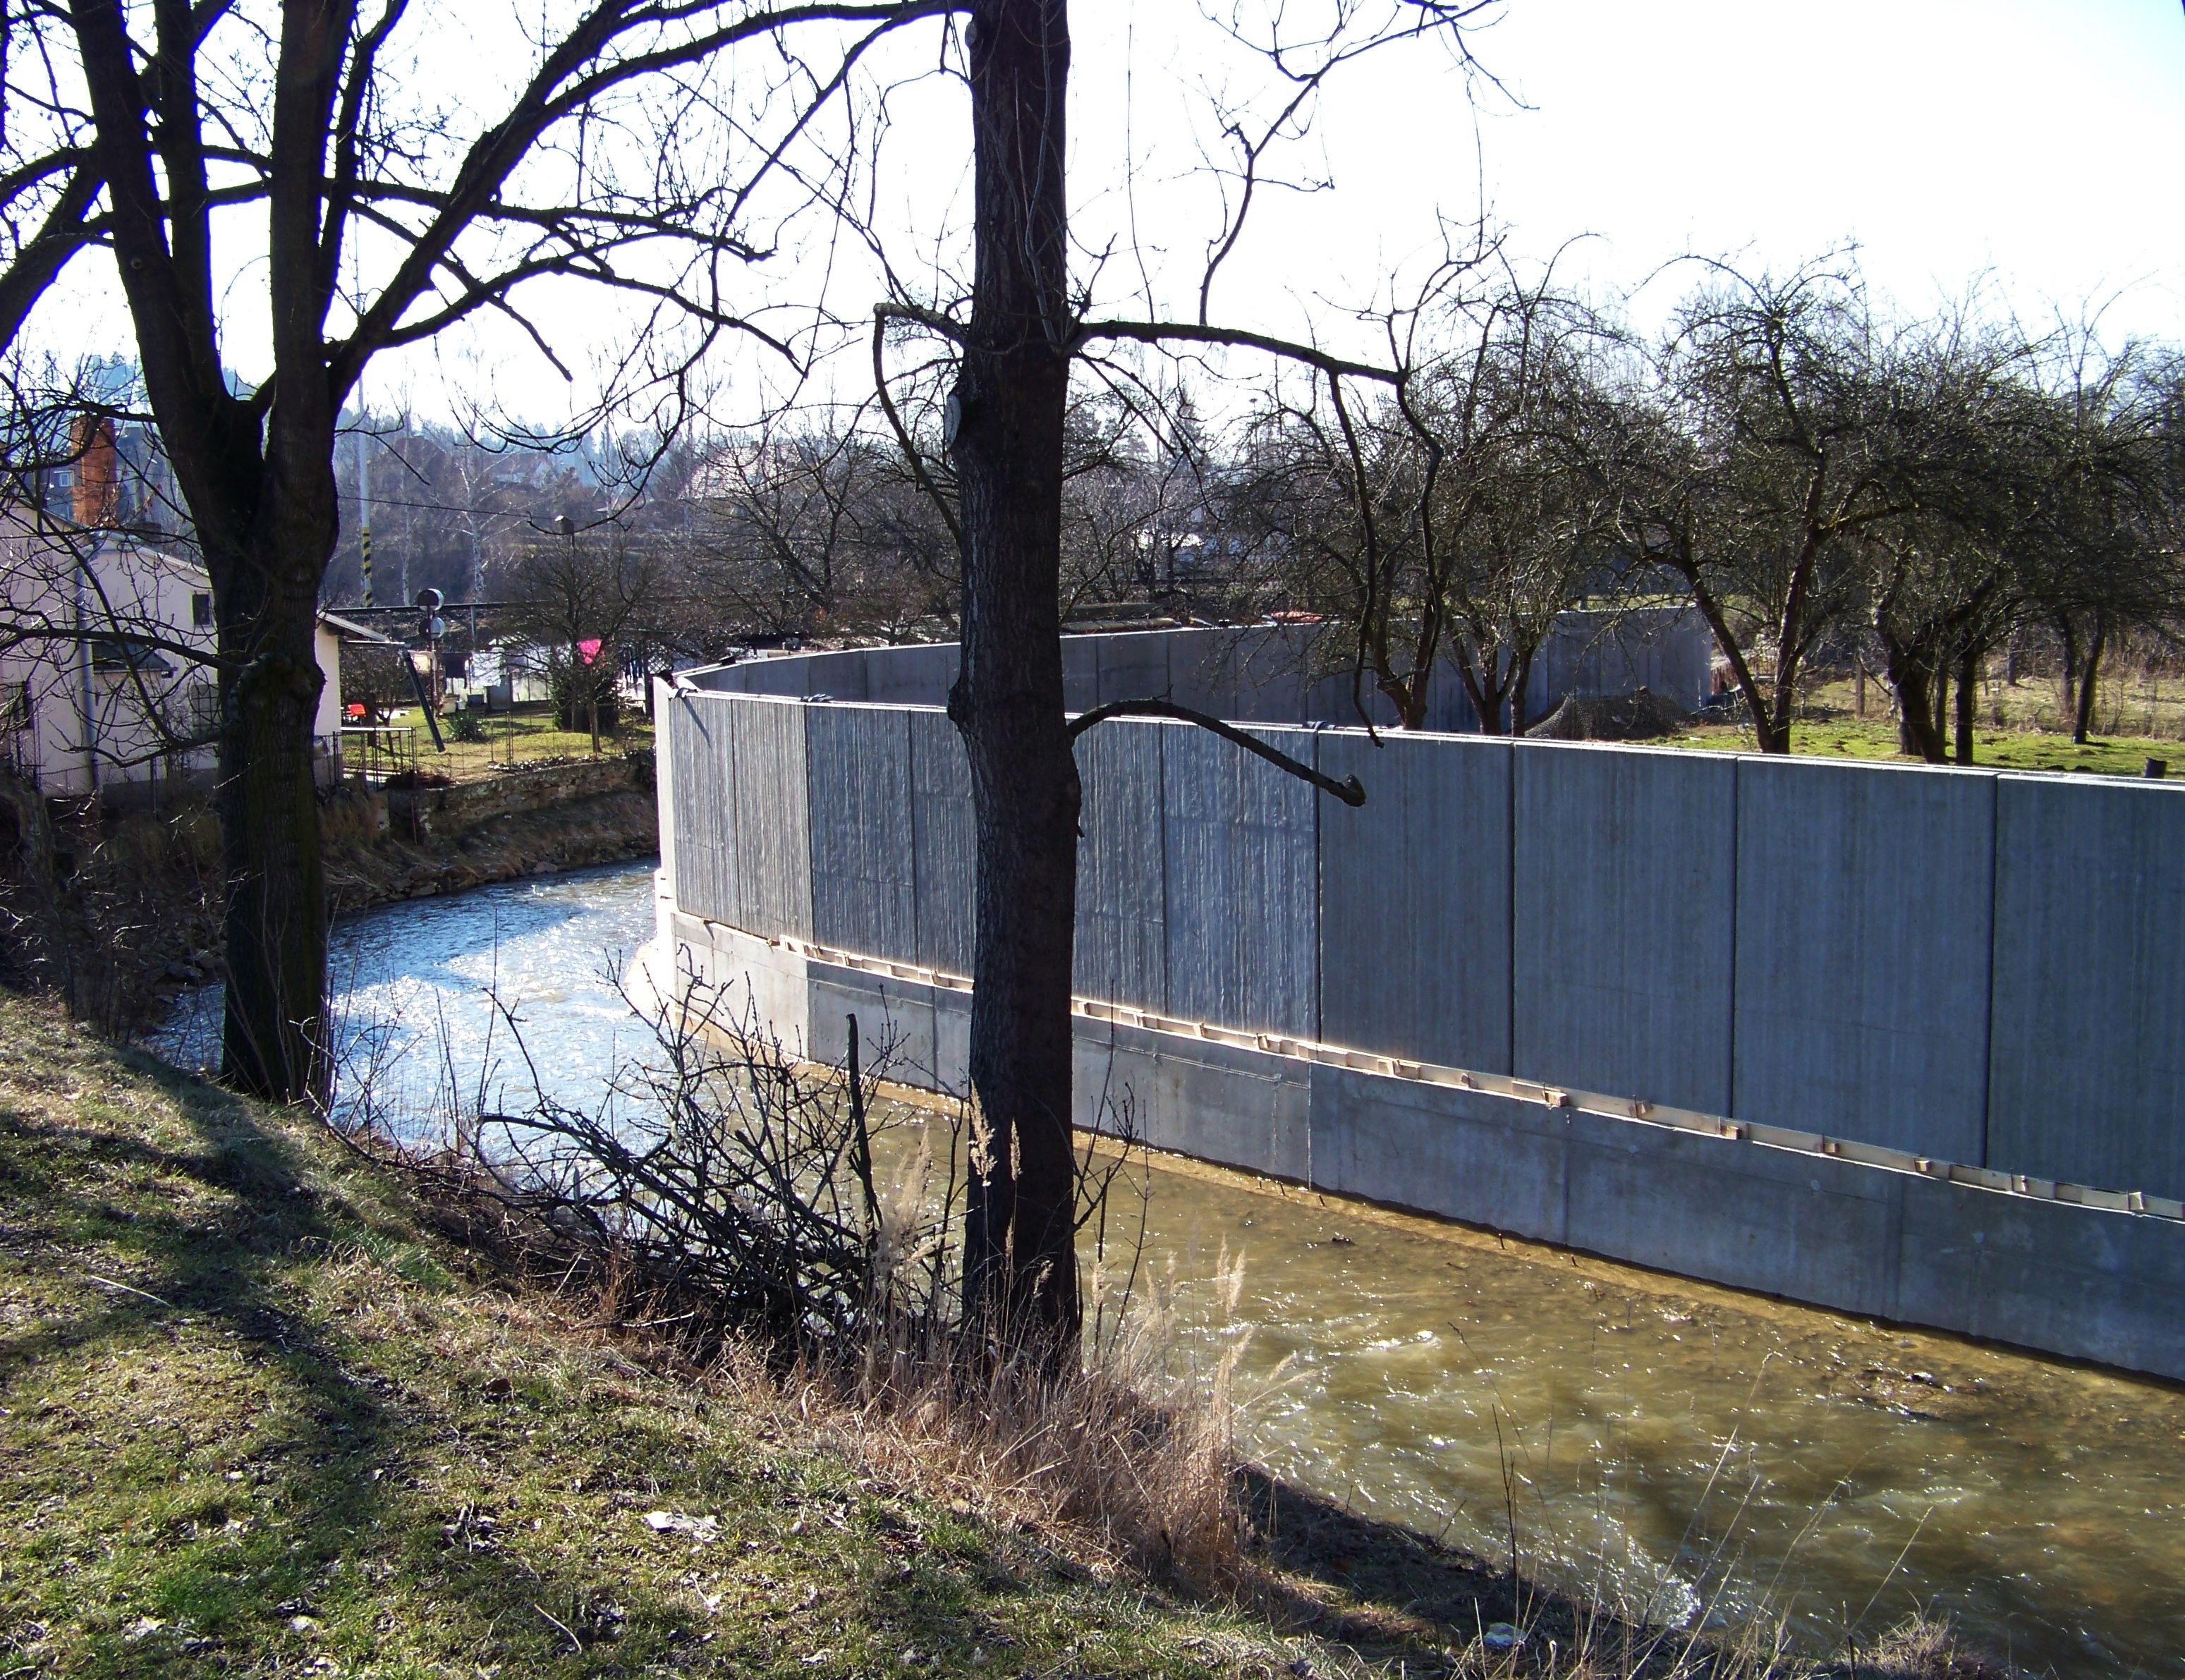
If the risk you are assessing is this stream flooding the property behind the flood wall, your risk formula would be:
Risk (flood) = T (chance of flood) x V (chance of damage) x C (impact of damage)
Risk (flood) = 5 (stream floods every spring) x 1 (wall is high enough to stop all floods) x 1 (no damage behind the flood wall)
Flood risk score = 5
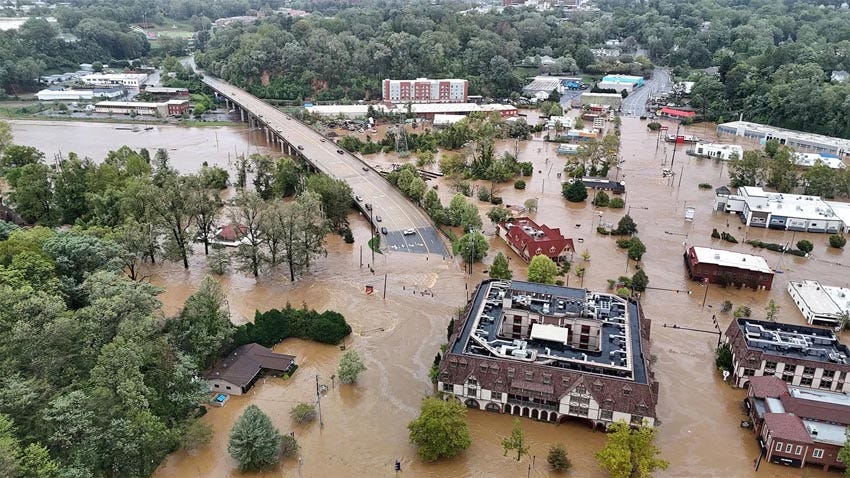
Here is where the formula gets wonky. Imagine you have a city that’s 300 miles inland, 2,000 feet above sea level, and hasn’t had a major flood in more than a century. The risk formula for a flood would be:
Risk (flood) = T (chance of flood) x V (chance of damage) x C (impact of damage)
Risk (flood) = 1 (low chance of flooding) x 1 (no history of flood damage) x 5 (catastrophic damage if there was a flood because the city has no flood mitigation)
Flood risk score = 5
This scenario is Asheville, North Carolina when Hurricane Helene moved inland and stalled in the Appalachian Mountains. A North Carolina Forest Service weather station recorded 31.33 inches of rain which was more than double the recorded rainfall for any other storm in state history. The chance of this scenario happening was low (1) and the history of flood damage was low (1), but the consequence was catastrophic (5).
The problem with the R = T x V x C formula is the property next to the stream that has high flood risk (5) every spring and has mitigated flood damage (1) scores a 5. A city that has a low chance of flooding (1) but it will be catastrophic if flooding happens (5) also scores a 5. The flood risk at these two locations is very different but they get the same score!
When you look at this simple 5x5 risk graphic, the problem is obvious. Why is a rare/severe risk (bottom right) the same risk score as a certain/insignificant risk (upper left)? If there is something you know will happen but it doesn’t impact operations or cause damage, it shouldn’t have the same score as a risk that’s very unlikely but destroys an entire city if it happens.
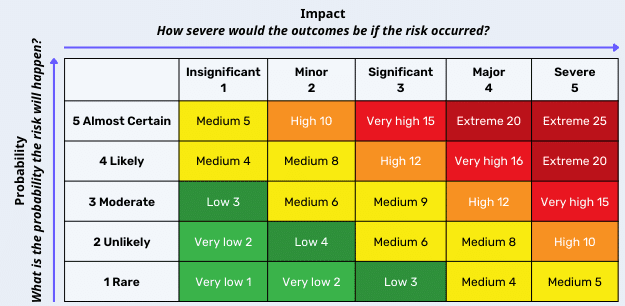
An example at a stadium is fans sneaking in alcohol. This is an almost certain threat (5) that shows security screening for prohibited items has failed. The impact is insignificant (1) because most drunk fans don’t cause problems and the stadium only missed out on a few dollars in concession sales. On the flip side, someone wearing a bomb vest and getting past security is extremely rare (1) but the consequence is severe (5).
Using the simple risk formula, sneaking in alcohol and sneaking in a bomb vest are both rated as 5 or medium risk.
Importance of ‘Consequence’
A property with a flood wall and a city with catastrophic flood risk both score a 5 in the traditional risk equation because each element has the same weight. As we can see from Asheville, the high consequence of an unlikely risk needs to be reflected. The first way to fix the risk formula is:
R = T x V x (C²)
Squaring the consequence value completely changes the risk scores:
Flood mitigated property: R = 5 x 1 x 1² is a risk score of 5
Asheville flooding: R = 1 x 1 x 5² is a risk score of 25
By squaring consequence, the real-world deaths, injuries, and property destruction that result from the risk carry the most weight in the calculation.
Different Approach
In a traditional three variable 1-5 score risk model, high probability/low consequence risks and low probability/high consequence risks can have the same scores and the maximum score is 125. When the consequence is squared, there is a much larger distribution of the values because the maximum becomes 625.
For low consequence risks, the max score is 25 (R=5x5x1²). For high consequence risks, the minimum score is 25 and even low threats and vulnerabilities have high scores if there are catastrophic consequences (R=2x2x5² is risk score of 100).
At the middle of the distribution, most risks are moderately likely and moderately disruptive. On the far ends of the curve, you have the risks that are very likely but minimal impact (far left tail at >-2σ), and risks that are very unlikely with catastrophic impact (right tail at >+2σ). These are the 2% or less scenarios like catastrophic hurricane flooding risk for an inland city. Unlike a square matrix, you can ignore the green side with the left tail risks because they are low impact and focus on the red right tail risks because they have catastrophic consequences.
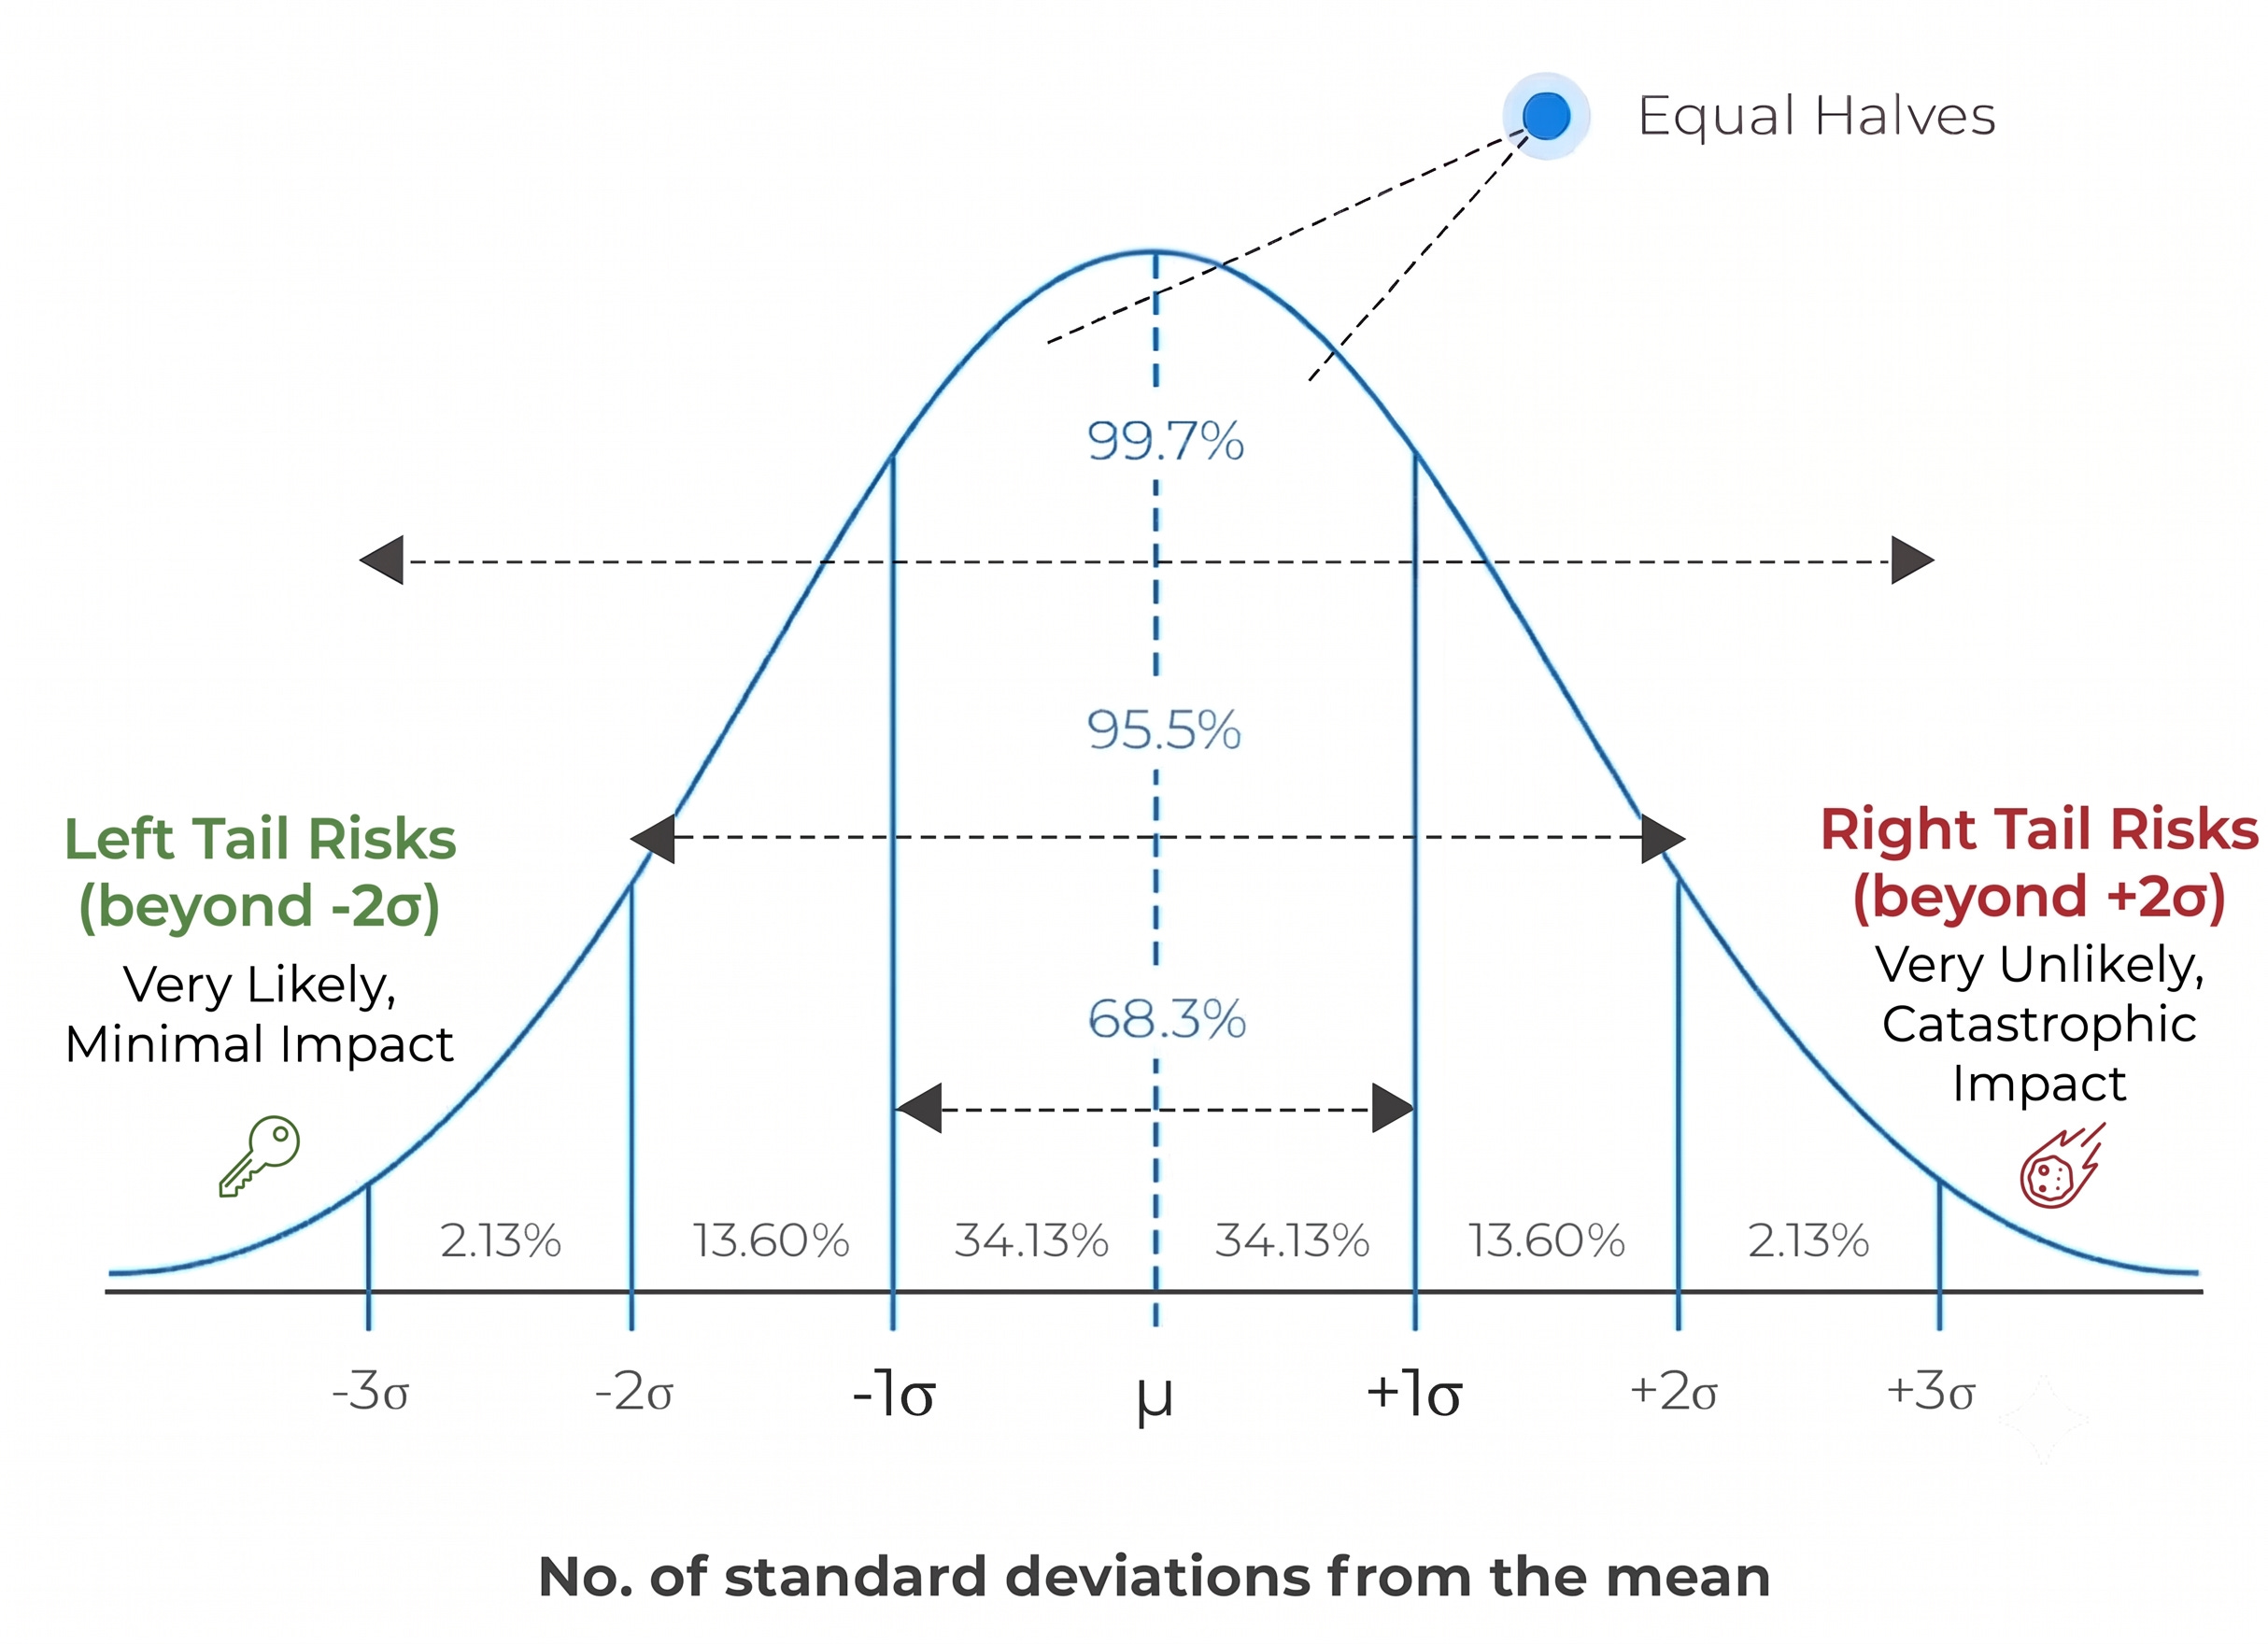
Now that we have a larger range of scores across the normal distribution curve, we can take it a step further. Instead of risks being compared on a static and linear scale from just low values to high values, we can add dynamic scoring that measures interactions between risk and mitigation.
(Note: It would take a full semester course to explain the different ways risk can be calculated and the results can be organized. At a place with many constant low-level risks and very few unlikely but catastrophic risks, the results might not be a normal distribution. Depending on the risk scores, the best way to organize the data could be power law, exponential, heavy-tailed, Poisson distribution, or an AI-method like k-mean clustering. My explanations are simplified to keep this article under 3,000 words.)
Keep reading with a 7-day free trial
Subscribe to Riedman Report: Risk, AI, Education, & Security to keep reading this post and get 7 days of free access to the full post archives.